
AI RFP Analytics & Reporting
See What's Actually Winning
Track win rates, RFP volume, and the content driving wins.

Teams replacing old RFP workflows with AI agents
Results manufacturers report with Inventive
50%
Higher
Win Rates

90%
Faster
RFP Completion Time

2.5X MORE
SUBMISSIONS
in just 3 months


The Insights Behind Every Winning Bid.

See what's actually working — and where deals stall
Track wins, losses, deal size, and abandonment rate across your pipeline, plus how long a project actually takes start to finish — segmented by product, region, deal size, or buyer type, instead of feeling out the pattern from memory after each deal closes.

Know which content is pulling its weight
See which pieces of your Knowledge Hub actually show up most in the responses that win, so you know what to keep current and what's just taking up space.

See who's actually using it, not just who has a seat
Active users, logins, onboarding and offboarding, and how often your team is saving new answers back into the Knowledge Hub — all in one view, so rollout stops being a guess.
Get an answer without building a report
Ask a plain-language question — "How many RFPs did we win from Benelux last year?" — and get an answer directly, instead of exporting data into a separate BI tool.


How Every RFP Becomes an Insight.

Every project feeds the same data set
RFPs, RFIs, questionnaires, and DDQs run through Inventive all add to your reporting automatically — no separate export step.

Mark outcomes as deals close
Win, loss, and abandonment get recorded per project, so a stalled questionnaire shows up as clearly as a won deal, and your win rate updates across however you're segmenting it.

See what content is actually working
Usage reporting shows which pieces of your Knowledge Hub show up most in the responses that win.

See how AI is actually being used
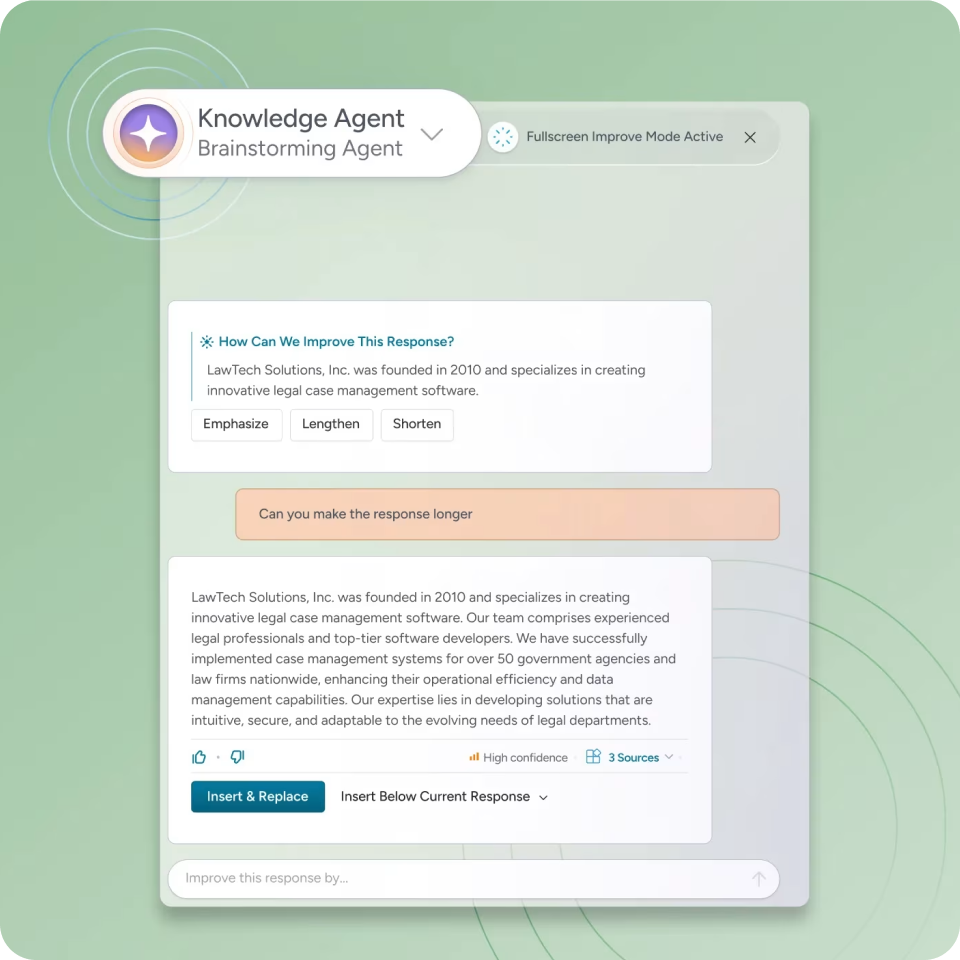
Every response gets broken down by source — Bulk Generate, Document Editor, Questionnaire, Agent Hub, Improve with AI, or the Chrome Extension — and by confidence, so you can see where AI is carrying the most weight and where more review is happening.

Ask instead of building a report
Type a plain-language question and get an answer directly, instead of exporting to a separate tool.

Share what leadership needs
Pull the numbers for a pipeline review without rebuilding a deck from scratch each time.

Reporting on work your team is already doing

Sharepoint

Notion

Confluence

Google Drive

Slack

Salesforce



Insights & Reporting, answered
To address any concerns or curiosities you might have, here are answers to some frequently asked questions about RFP knowledge base:
What can I actually see in reporting?
RFP volume, win/loss rates, deal size, abandonment rate, and which content gets used most in your responses, segmented however you track your pipeline — product, region, deal size, or buyer type.
What's actually in the reporting dashboard?
Four views: pipeline and deal reporting (wins, losses, deal size, abandonment rate, and how long a project takes), AI usage reporting (every response broken down by source and confidence), team and adoption reporting (active users, logins, onboarding, and Knowledge Hub saves), and ask-anything reporting for anything that doesn't fit a standard view.
Do I need to build a custom report to answer a specific question?
No. Ask in plain language — for example, "How many RFPs did we win from Benelux last year?" — and get an answer directly.
Can I see how AI is actually being used, not just how many responses it generated?
Yes. AI usage reporting breaks every response down by source — Bulk Generate, Document Editor, Questionnaire, Agent Hub, Improve with AI, or the Chrome Extension — and by confidence level, so you can see where AI is doing the heaviest lifting and where more review is happening.
Can I track whether my team is actually adopting the platform?
Yes. Team reporting shows active users, logins, onboarding and offboarding, and how often the team is saving new content back into the Knowledge Hub.
Does this cover RFIs, DDQs, and security questionnaires, or just RFPs?
All of them. Every project run through Inventive feeds the same reporting, regardless of the request type.
How is win rate calculated?
Win or loss gets marked per project as deals close, and your win rate reflects whatever you're currently tracking as won versus lost across your account.
Can I see which specific content is winning us deals?
Yes. Content performance reporting shows which pieces of your Knowledge Hub actually appear in the responses that win.
Is our reporting benchmarked against other customers?
No. Reporting reflects only your own account's data — never compared against or blended with other customers'.
Is our data used to train AI models?
No. Customer data is not shared with third parties, and Inventive is SOC 2 Type II compliant.