Win-Loss Analysis: How It Works, steps, and the Best Software
Win-loss analysis shows why you win and lose deals. Learn what it is, how to run it, why deals are lost, and the software that helps.
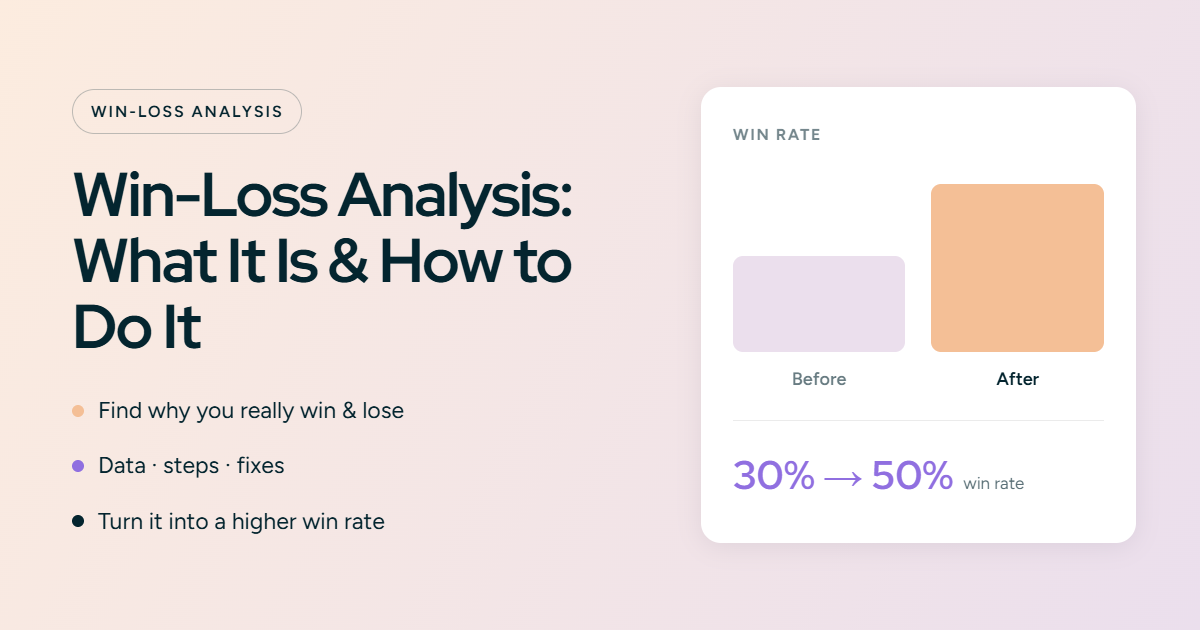
Ask a rep why they lost a deal, and you will usually hear one word: price. Check the CRM, and it says the same. But the real reason is often something else: a slow response, a missing feature, a competitor who answered a security question better. Win-loss analysis is how sales and revenue teams find out what actually drove each decision.
This guide explains what win-loss analysis is, the data you need, how to run it step by step, why deals are won and lost, the mistakes to avoid, and the software that helps. It is written for sales, revenue, and proposal teams that want to win more deals, not just track results.
TL;DR
- Win-loss analysis is the process of reviewing your won and lost deals to find out why buyers chose you, a competitor, or no one, so you can win more deals.
- It uses three data sources: your CRM and deal data, the activity inside each deal, and feedback from the buyer. The CRM shows what happened. The buyer tells you why.
- Run it as a repeating cycle: set a goal, pull the data, interview buyers, group the findings, act on the top ones, and repeat each quarter.
- Software helps at scale. Win-loss tools collect buyer feedback and group it into themes. And if you sell through RFPs, your past responses already show which bids you lost and why.
What is win-loss analysis?
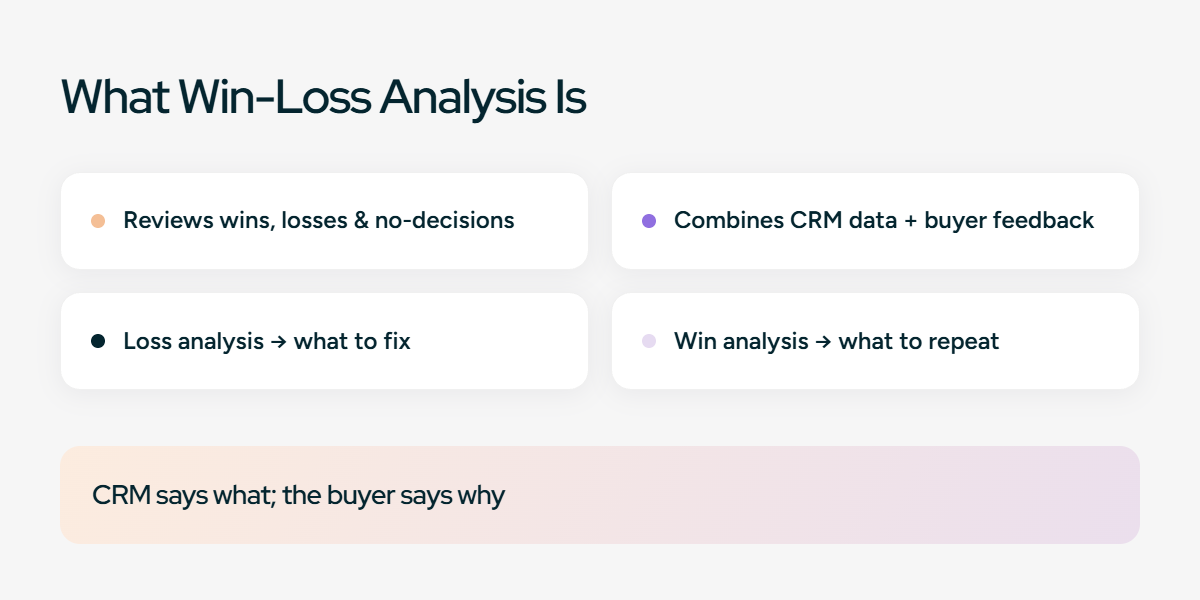
Win-loss analysis is the practice of reviewing your closed deals to understand why buyers picked you, a competitor, or no one. It combines two inputs: your CRM data and direct feedback from buyers. The goal is to find the reasons that repeat across deals, because those are the ones you can fix.
Your CRM alone won't show them. When a rep loses a deal, they log a reason in the CRM. That reason is a quick guess, and it is often not the real one. A deal might say "lost on price," when you actually lost because your setup took too long, or because a competitor answered a security question better. Win-loss analysis tests that logged reason against what the buyer actually says, so you act on the real cause.
The work has two halves. Loss analysis reviews the deals you lost and usually surfaces the clearest fixes, because it shows where you lose revenue. Win analysis reviews the deals you won, so you know which strengths to repeat. A full program runs both, plus the no-decision deals in between.
Why win-loss analysis matters
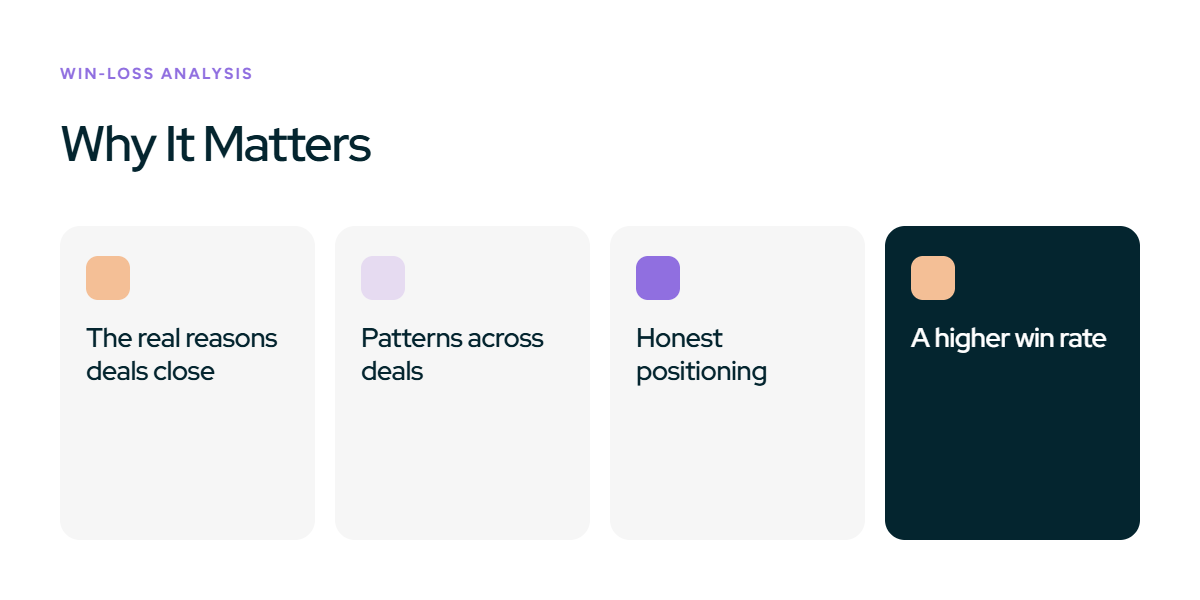
Without it, teams fix what they think is wrong, based on gut feel and the last deal they lost. A structured program gives you facts instead. It gives you four things.
- The real reasons deals close. You find out what actually drove each decision. Then you fix the problems that are losing you deals, not the ones you assume are.
- Patterns across deals. One lost deal tells you little. The same reason across ten or twenty losses, a slow proposal, a missing feature, a weak security answer, points to a real problem worth fixing.
- Honest positioning. You hear how buyers describe your competitors, and where they rate you higher or lower, in their own words. That is more reliable than a battle card written in-house.
- A higher win rate. Fixing the same issues over time adds up. GGartner covers win-loss analysis as a distinct discipline for improving go-to-market decisions in its Market Guide for Win/Loss Analysis Solutions.
What data you need for a win-loss analysis
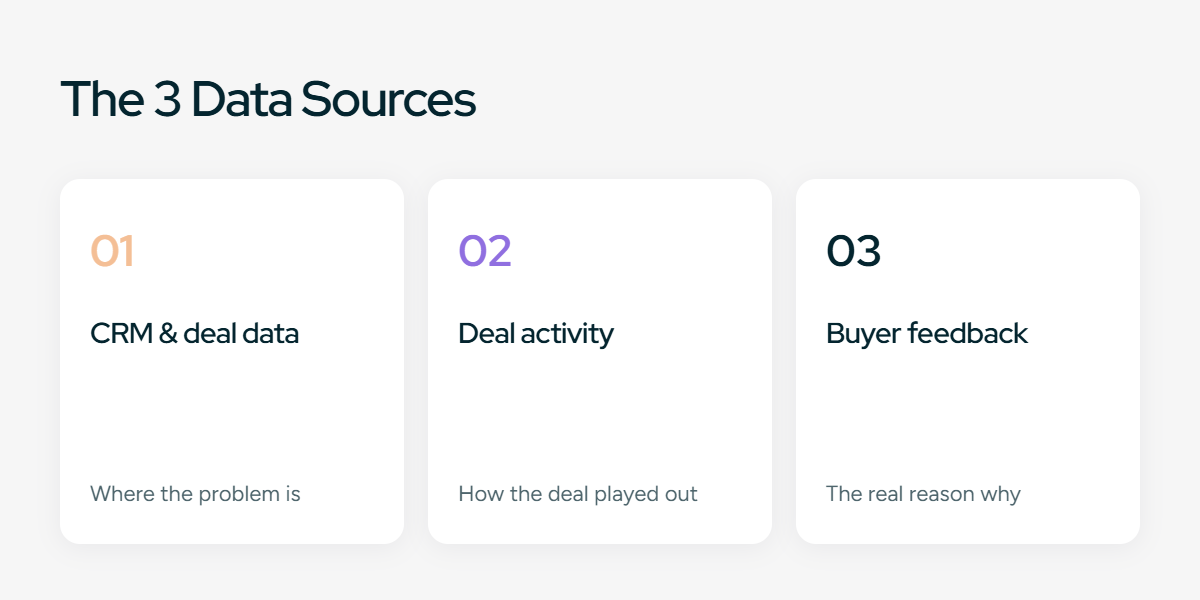
A good analysis uses three data sources. Each one fills a gap the others leave.
- CRM and deal data. Your win rate, deal size, sales cycle length, the stage where deals stall, and the competitor on each deal. These numbers tell you where to look and let you break results down by deal size, industry, or region.
- Deal activity. What happened inside each deal: call notes, emails, demos, and the proposals or RFP responses you sent. This shows how the deal played out, not just how it ended.
- Buyer feedback. What the decision-maker says drove their choice. This is the source that reveals the real reason. Most teams skip it, because it takes an interview or a survey to collect.
The numbers tell you where the problem is. The buyer tells you why. You need both.
How to do a win-loss analysis, step by step
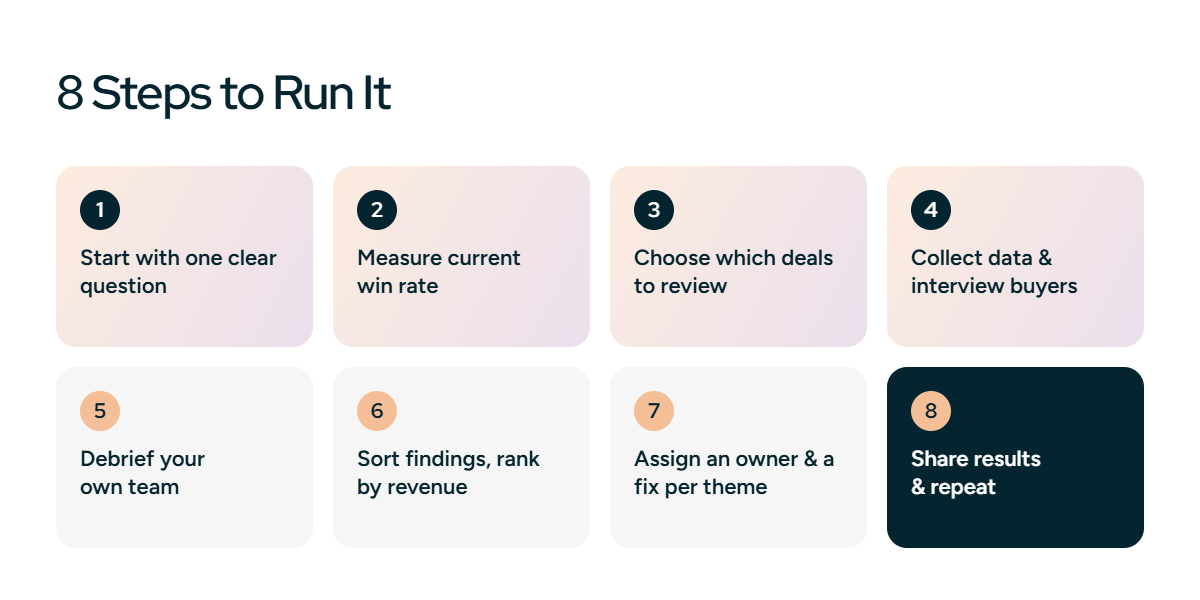
Run win-loss analysis as a repeatable process, not a one-time project. These seven steps work whether you review 20 deals or 200.
Step 1: Start with one clear question
Decide what you want to learn before you pull any data. A narrow question gives you an answer you can act on. A broad one gives you a report nobody uses.
Strong starting questions:
- Why are we losing enterprise deals to one specific competitor?
- Why do deals in a given industry or segment convert lower than the rest?
- Why do so many deals end in no-decision instead of a clear win or loss?
- If you sell through RFPs: why do we lose after we submit the proposal?
Pick one question per analysis. Run the next one on a different question later.
Step 2: Measure your current win rate
You need a starting number to prove your changes worked. Divide the deals you won by the total deals that reached a decision, won or lost. If you won 30 of 100 decided deals, your win rate is 30%. Leave out open and no-decision deals so the number reflects head-to-head outcomes.
Break the win rate down by segment too, such as deal size, industry, or competitor. A 30% overall rate can hide a 55% rate in the mid-market and a 12% rate in enterprise. Those two need different fixes.
Step 3: Choose which deals to review
Choose recent deals closed in the last one to two quarters, while the buyer still remembers the details. Include all three outcomes, not just losses:
- Wins, to learn what to repeat.
- Losses, to learn what to fix.
- No-decisions, to learn why deals stall, which is often your biggest leak.
Aim for 10 to 20 deals in a first round, weighted toward the segment in your Step 1 question. A balanced set gives you real patterns. Picking only the deals you remember gives you bias.
Step 4: Collect the data and interview buyers
Start with what you have. For each deal, pull the CRM record (deal size, competitor, stage lost, recorded reason), the activity history (emails, call notes, demos), and the proposal or RFP response you sent. Clean it first: fix missing close reasons and wrong competitor tags, or your patterns will be wrong.
Then get the buyer's side. Book a 20 to 30 minute call within 30 to 60 days of the decision. Have someone other than the deal owner run it, because buyers soften their feedback to the person who sold to them. Ask the same open questions every time so you can compare answers:
- What problem were you solving, and what made you start looking?
- Which vendors did you seriously consider?
- What were the three or four factors that decided it?
- Where were we strong, and where did we fall short?
- How did our price compare to the value you expected?
- For RFP deals: was anything in our proposal unclear, missing, or late?
Interview a few won deals too. The reasons you win are as useful as the reasons you lose.
Step 5: Debrief your own team
Most buyers will not take the call, so don't rely on interviews alone. Your own team saw the full deal and costs nothing to ask. Debrief the rep, the sales engineer, and the proposal lead on each deal:
- How did the deal progress, and where did it turn?
- What objections came up most often?
- Were there internal delays, such as slow approvals or a late proposal?
Treat their input as one view, not the final word, since sellers tend to blame price. Use it alongside the buyer's account and the deal data, not instead of them.
Step 6: Sort the findings and rank by revenue
Put everything in one simple table so patterns show up. One row per deal:
Deal | Outcome | Competitor | Primary reason | Category | Deal value
Sort each reason into a fixed set of categories: price and value, product fit, timing, competitor strength, sales process, and proposal quality. Using the same categories every time lets you compare one quarter to the next.
Then rank by revenue, not by count. Count tells you how often a reason appears. Revenue tells you what it costs. A product gap in three lost deals worth $2M matters more than a price objection in eight deals worth $200K. Add up the deal value behind each category and fix the ones carrying the most revenue first.
Step 7: Assign an owner and a fix to each theme
Findings only matter if someone changes something. Take the two or three categories with the highest revenue impact. For each one, write down three things: the change, the owner, and the metric it should move.
For example:
- Theme: losing enterprise deals on slow proposal turnaround. Change: build a reusable answer library for the top 50 RFP questions. Owner: proposal lead. Metric: proposal turnaround time and enterprise win rate.
- Theme: a missing integration cited in four losses. Change: add it to the product roadmap. Owner: product manager. Metric: losses tagged to that gap.
A finding with no owner and no metric changes nothing.
Step 8: Share the results and repeat
Send each team only the findings that apply to them: winning tactics and objections to sales, feature gaps to product, buyer language to marketing, and slow or weak-answer patterns to the proposal team. Keep the summary to one page: what you learned, what you are changing, and what you will watch next quarter.
Then run it again next quarter, and check whether the win rate from Step 2 moved. That loop: measure, change, measure again, is what turns win-loss analysis into a rising win rate.
Losing deals to slow, unclear responses? Inventive AI drafts your RFP, RFI, DDQ, and security answers from approved content and flags weak ones before you submit.
[Book a demo]
Why deals are won and lost
Most win-loss findings fall into a few categories. Knowing them helps you sort your data faster and see which one costs you the most.
- Price and value. The buyer thought you cost too much, or did not see the value for the price. Often the real issue is how well the seller tied the price to the buyer's outcome, not the price itself.
- Product fit. A feature the buyer needed was missing, weak, or unclear. This is the most useful finding, because it points product and marketing at a specific gap.
- Timing and priority. The project lost budget, urgency, or an executive sponsor. These usually show up as no-decision deals, and no-decision is often the biggest category in B2B pipelines.
- Competitor strength. A competitor had a feature, a relationship, or a proof point you could not match. This shows you exactly where to sharpen your positioning.
- Sales process. A slow response, a missed follow-up, or the wrong stakeholder in the room. You can fix these without changing the product.
- Proposal and response quality. When a deal runs through an RFP, the response itself decides a lot. A late submission, a missed requirement, or a vague answer on security or pricing loses deals you could have won.
How to improve your win rate
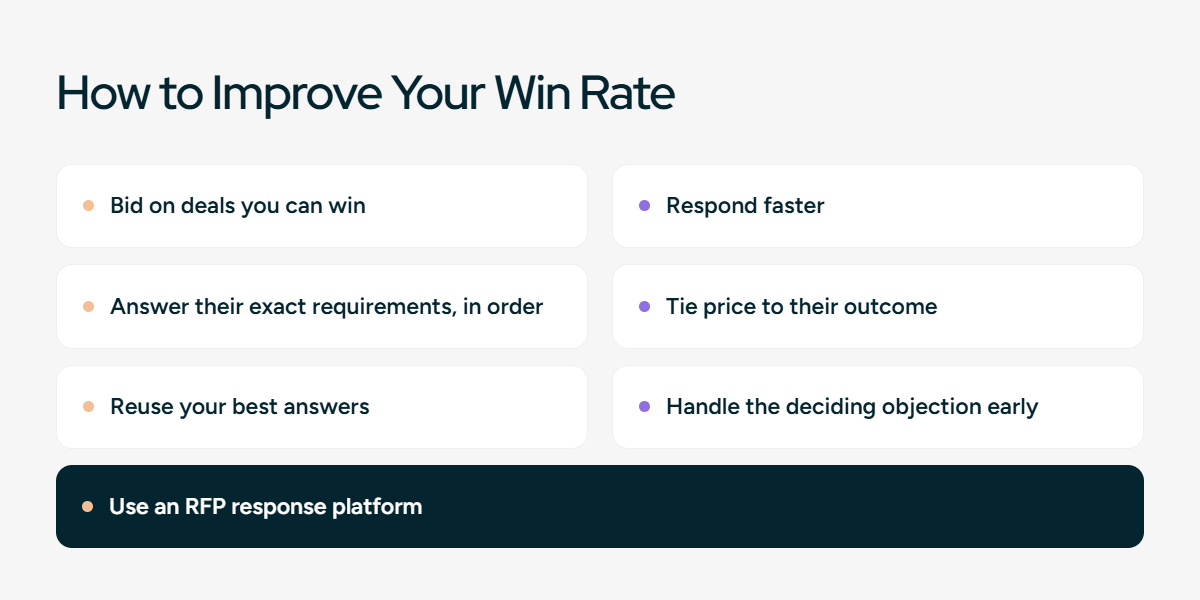
Win-loss analysis tells you why you lose. These are the fixes that come up most often, and how to apply them.
- Bid on the deals you can actually win. Chasing bad-fit deals lowers your win rate and burns your team's time. Set clear go/no-go criteria, budget, timeline, fit, and a real champion, and decline the deals that fail them. Winning 40% of 50 good-fit deals beats winning 15% of 150.
- Respond faster. In competitive deals, the vendor who responds first often sets the buyer's criteria. Cut the time between the buyer's request and your proposal. A same-week response keeps you in control; a two-week one lets a competitor frame the decision.
- Answer the buyer's exact requirements, in their order. Buyers and RFP evaluators score you against a specific list. Mirror that list, address their top priorities first, and never leave a question blank. If something doesn't apply, say so and why. A missed or vague answer on security or pricing loses deals you were winning.
- Tie your price to their outcome. When a deal is "lost on price," the real problem is usually that the buyer didn't see enough value for the cost. So don't just defend the number. Show what they get for it: the hours saved, the risk removed, the revenue gained. A price only looks high when the value behind it is unclear.
- Reuse your best answers, don't rewrite them. Your winning proposals already contain your strongest answers. Keep them in one approved library and reuse them, so every response is consistent and high-quality, even when several people write it. Inconsistent, from-scratch responses are slower and weaker.
- Handle the deciding objection before the buyer raises it. Win-loss will show you the concern that repeats, a long implementation, a missing certification, a security gap. Address it directly in your proposal and your calls, rather than hoping it goes unnoticed.
- Use an RFP response platform. If you win through RFPs, the response decides a lot, and doing it by hand is slow and inconsistent. RFP response software drafts each answer from your approved, best-performing content and flags gaps before you submit. It fixes the exact issues win-loss surfaces most, slow turnaround, missed questions, and inconsistent answers, so more of your bids stay competitive.
Win-loss analysis software and tools
You can run a small analysis in a spreadsheet, but it stops working as your deal volume grows. Win-loss software collects feedback and finds patterns at scale. It comes in two types.
- Dedicated win-loss platforms. These run buyer interviews and surveys, tag the feedback, and roll it up into themes and dashboards. They fit teams that run win-loss as an ongoing program across many deals.
- Response and proposal software. If you sell through RFPs, your response platform already holds loss data most programs ignore: which bids you won, where they stalled, and which answers showed up in winning versus losing responses. That is loss analysis you already own.
The two work together. A win-loss platform tells you buyers found your proposals slow or unclear. Your response software is where you fix it.
How win-loss analysis improves your RFP win rate with Inventive AI
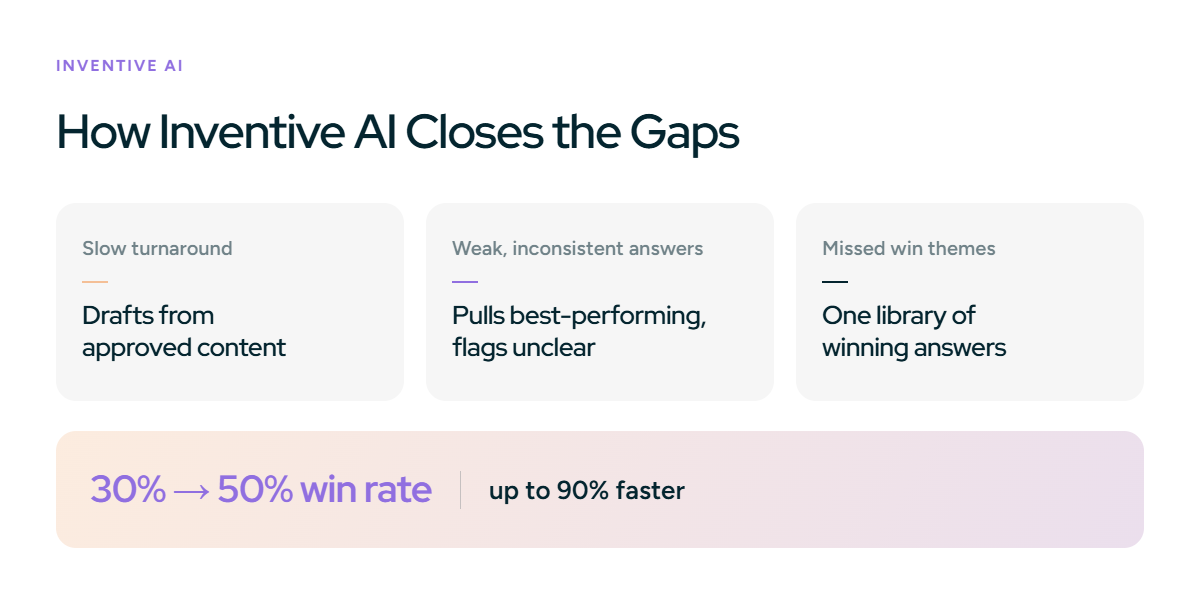
Win-loss analysis on RFP deals gives you two things to use in every future bid: competitive intelligence, where you beat each competitor and where they beat you, and your win themes, the value points that made buyers choose you. It also shows why you lose bids: a late response, a missed question, or a vague answer on security or pricing.
Knowing this is only half the job. You still have to put those win themes into every proposal and fix the gaps, without slowing your team down. That is where Inventive AI helps. It closes the gaps win-loss surfaces most:
- Slow turnaround: it drafts each response from your approved content, so your team reviews instead of writing.
- Weak or inconsistent answers: it pulls from your best-performing responses and flags anything unclear before you submit.
- Missed win themes: you keep your strongest, buyer-validated answers in one library, so the themes that win show up in every response.

.avif)